Understanding RSI and Divergence
The Relative Strength Index (RSI) is a popular technical indicator used by traders and investors to analyze the strength and momentum of a price trend. It measures the speed and change of price movements and provides insights into whether an asset is overbought or oversold. One of the key concepts associated with RSI is divergence, which can indicate potential trend reversals. In this article, we will explore the concepts of bullish and bearish divergence and provide examples with diagrams.
Bullish Divergence

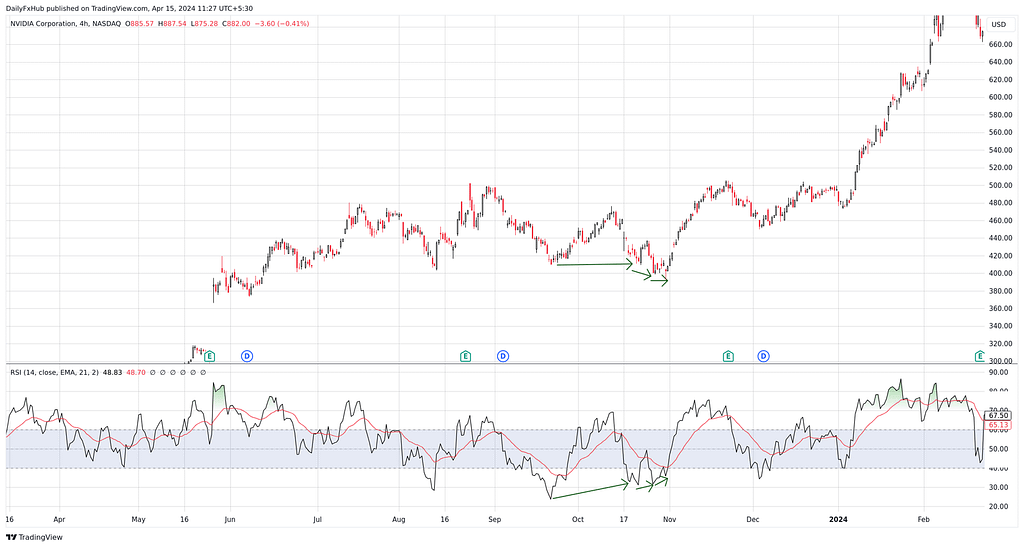
Bullish divergence occurs when the price of an asset makes lower lows, but the RSI indicator forms higher lows. This suggests that the momentum of the price decline is weakening, and a potential bullish reversal may be on the horizon. Traders often interpret this as a signal to buy or go long on the asset. Let’s take a look at an example diagram to better understand bullish divergence.
In the diagram above, we can see that the price of the asset (represented by the solid line) is making lower lows, indicated by the arrows. However, the RSI indicator (represented by the dashed line) is forming higher lows. This creates a divergence between the price and the RSI, suggesting that the downtrend may be losing momentum. Traders may interpret this as a potential buying opportunity, anticipating a bullish reversal.
Bearish Divergence
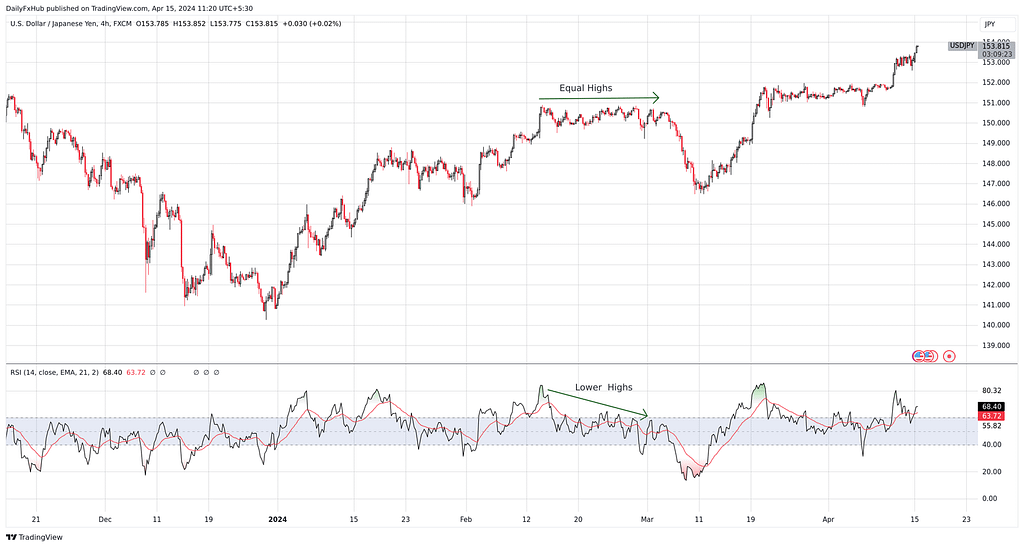
On the other hand, bearish divergence occurs when the price of an asset makes higher highs, but the RSI indicator forms lower highs. This indicates that the momentum of the price uptrend is weakening, and a potential bearish reversal may be imminent. Traders often interpret this as a signal to sell or go short on the asset. Let’s take a look at an example diagram to better understand bearish divergence.
In the diagram above, we can see that the price of the asset (represented by the solid line) is making higher highs, indicated by the arrows. However, the RSI indicator (represented by the dashed line) is forming lower highs. This creates a divergence between the price and the RSI, suggesting that the uptrend may be losing momentum. Traders may interpret this as a potential selling opportunity, anticipating a bearish reversal.
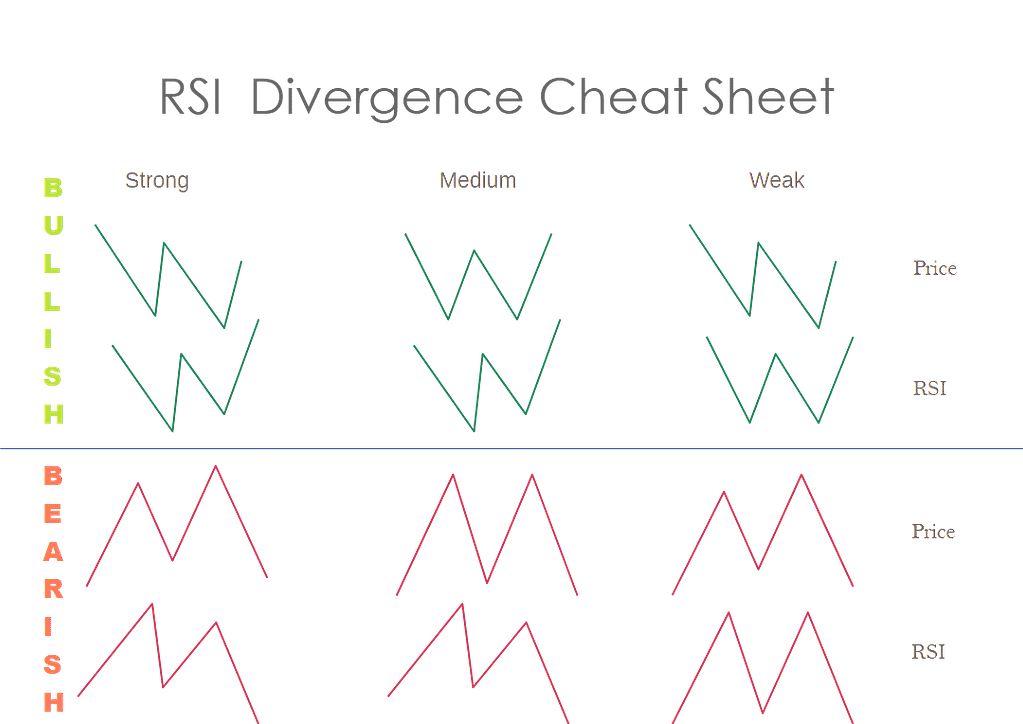
Multiple Bullish/Bearish Divergence
Multiple bullish or bearish divergences can occur within a trend, providing traders with additional signals to consider. These multiple divergences can strengthen the overall indication of a potential trend reversal. Let’s explore how multiple divergences can be identified and what they may suggest.
Multiple bullish divergences occur when the RSI indicator forms higher lows on multiple occasions while the price continues to make lower lows. This indicates a strengthening of the bullish signal and may suggest a higher probability of a trend reversal. Traders may view this as a strong buying opportunity.
Similarly, multiple bearish divergences occur when the RSI indicator forms lower highs on multiple occasions while the price continues to make higher highs. This indicates a strengthening of the bearish signal and may suggest a higher probability of a trend reversal. Traders may view this as a strong selling opportunity.
It’s important to note that while bullish and bearish divergences can provide valuable insights, they should not be the sole basis for making trading decisions. Traders should consider other technical indicators, fundamental analysis, and risk management strategies to make well-informed trading decisions.
Conclusion
In conclusion, RSI and its divergences are powerful tools for traders and investors to identify potential trend reversals. Bullish divergence occurs when the price makes lower lows while the RSI forms higher lows, indicating a weakening downtrend. Bearish divergence occurs when the price makes higher highs while the RSI forms lower highs, indicating a weakening uptrend. Multiple divergences can further strengthen these signals. However, it is important to use divergences in conjunction with other technical indicators and analysis for more accurate trading decisions.